SummitPK.com - for the best in pharmacokinetic software

Pharmacokinetic Software for Research and Education

PK Solutions - The easy way to do pharmacokinetics

Easy, fast, and interactive pharmacokinetic analysis software for research and education.

SummitPK.com - Pharmacokinetics Software
 

Home


Site Map

 
PK Solutions - easy, interactive, comprehensive pharmacokinetic analysis

PK Solutions


Metabase


PK Equations


Free Tools


Download Page


Join Forum


Resource Links


Order Information


Contact


Screen Shots and Features Tour of PK Solutions

Easy Pharmacokinetics with Excel  Curve Fit

PK Solutions - Curve Fit Sheet

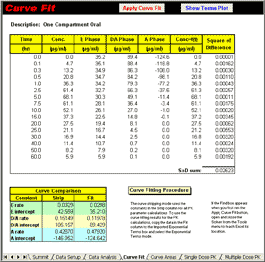
  • The Curve Fit page has two work areas, as illustrated in the next three screen shots.
  • Use of the Curve Fit sheet is optional. This is a stand-alone sheet and does not affect any of the other results.
  • The curve fitting work area automatically applies the method of least squares to obtain a set of disposition constants (intercepts and rates) that produce the best curve of the raw concentration-time data.
  • The initial intercept and rate constants for the curve fitting routine are taken either from those supplied in the Imported Exponential Terms table on the Data Setup sheet, or those obtained during the Data Analysis session (see above).
  • PK Solutions automatically sets up the data table based on the user Data Setup options and Data Analysis results. Clicking the Apply Curve Fit button begins the curve fit routine (which is shown in action) and results in filling in the Fit column in the Curve Comparison table.
PK Solutions - Curve Fit Graphs

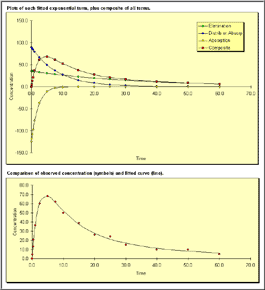
  • The two graphs automatically update after every time the curve fitting procedure is run.
  • The upper graph plots the best fit concentration-time values calculated for each best fit exponential term. This graph also includes a plot of the composite of all terms, which describes the best fit curve for the whole data set.
  • The second graph is an overlay of two plots. The symbols (circles) represent the actual raw data values. The smooth curve represents the best fit curve describing all the data, as obtained from the curve fitting procedure. This graph thus shows the variation of the raw data around the best fit curve.
  • The curve fitting data table is automatically constructed by PK Solutions and the graphs are instantly updated - all you have to do is click the Apply Run Curve button.
  • Any chart in PK Solutions can be modified and/or copied into another document or presentation using standard Excel operations.

Data AnalysisCurve Simulation


Pharmacokinetics Software from SummitPK.com
SummitPK.com for easy  pharmacokinetic data analysis software Pharmacokinetics Software from SummitPK.com
Copyright © 2007 Summit Research Services
Site designed and managed by Summit Research Services
PK Solutions Copyright © 1997-2007 Summit Research Services, All Rights Reserved
Contact: [email protected]
This site is located at http://www.SummitPK.com